This post covers my notes and findings from reverse engineering the Quick 6101A2
fume extractor's command protocol to integrate it into my other tools and
control it without the original controller. In part 1, we'll focus on analyzing
and parsing the protocol, mapping the sensor/control registers, then build a
simple terminal tool to monitor the fume extractor.
For a long time I had one of those cheap desktop fume extractors. They ship with
a coarse "filter" that feels more like a fume mixer than a device that actually
removes hazardous fumes. For light use they're fine, but lately I've been doing
more BGA reballing and rework, so I decided to upgrade to a proper HEPA unit and
went with Quick's 6101A2. I'd already
been happy with the build quality of their
861DW
hot-air station as well, and the price is hobbyist-friendly compared to JBC's
models, for example.
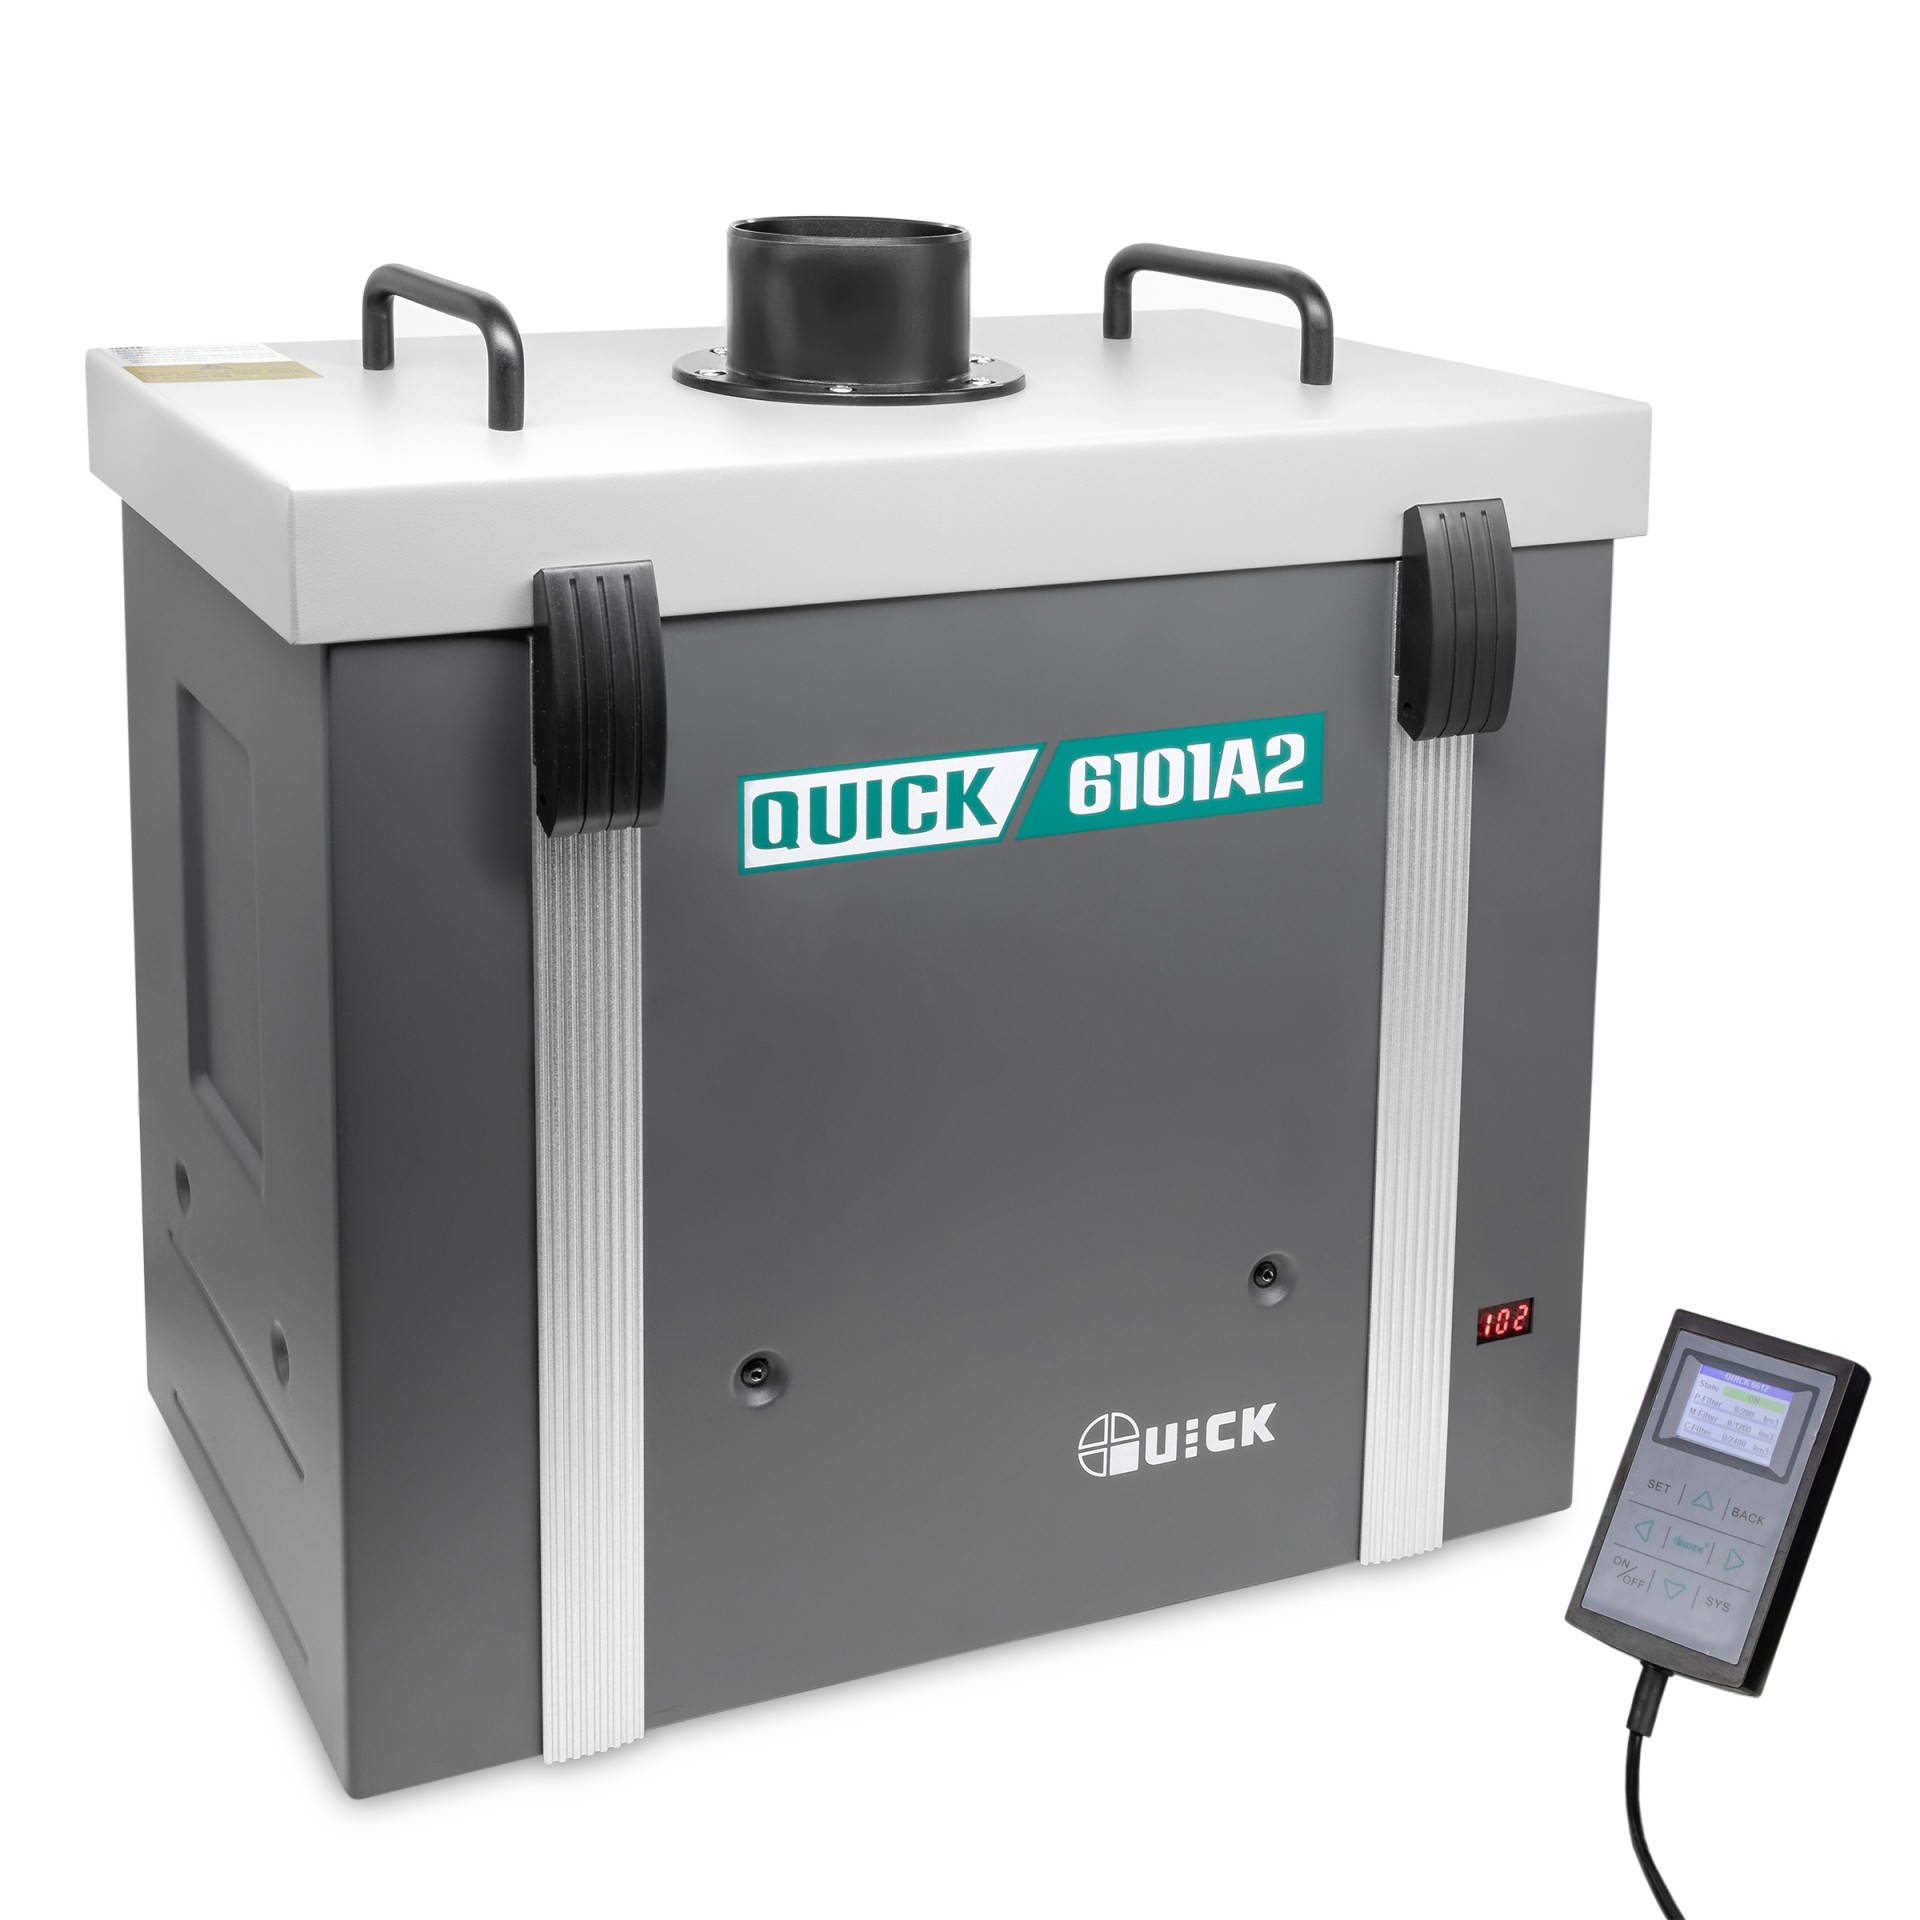 Quick 6101A2 main and controller unit.
The fume extractor consists of the main unit that has the filters, motor, etc.,
and a wired remote controller that can turn the device on/off, change settings,
and show the airflow, filter stats, etc. It also has a connector for external
devices, like a soldering iron or a hot air station, so it can turn on
automatically when you pick up the iron. Of course each manufacturer has their
own proprietary port/protocol to interconnect these devices, so I cannot
directly connect my JBC soldering station to my Quick 6101A2.
I decided to reverse engineer the communication protocol to allow me to build a
proxy between my solder station and the fume extractor. The obvious starting
point would be the external tool connector, but unfortunately I don't have any
devices that support it at the moment. So I decided to look into the
communication between the main unit and the controller. It wouldn't surprise me
if the controller and the external tool speak the same protocol.
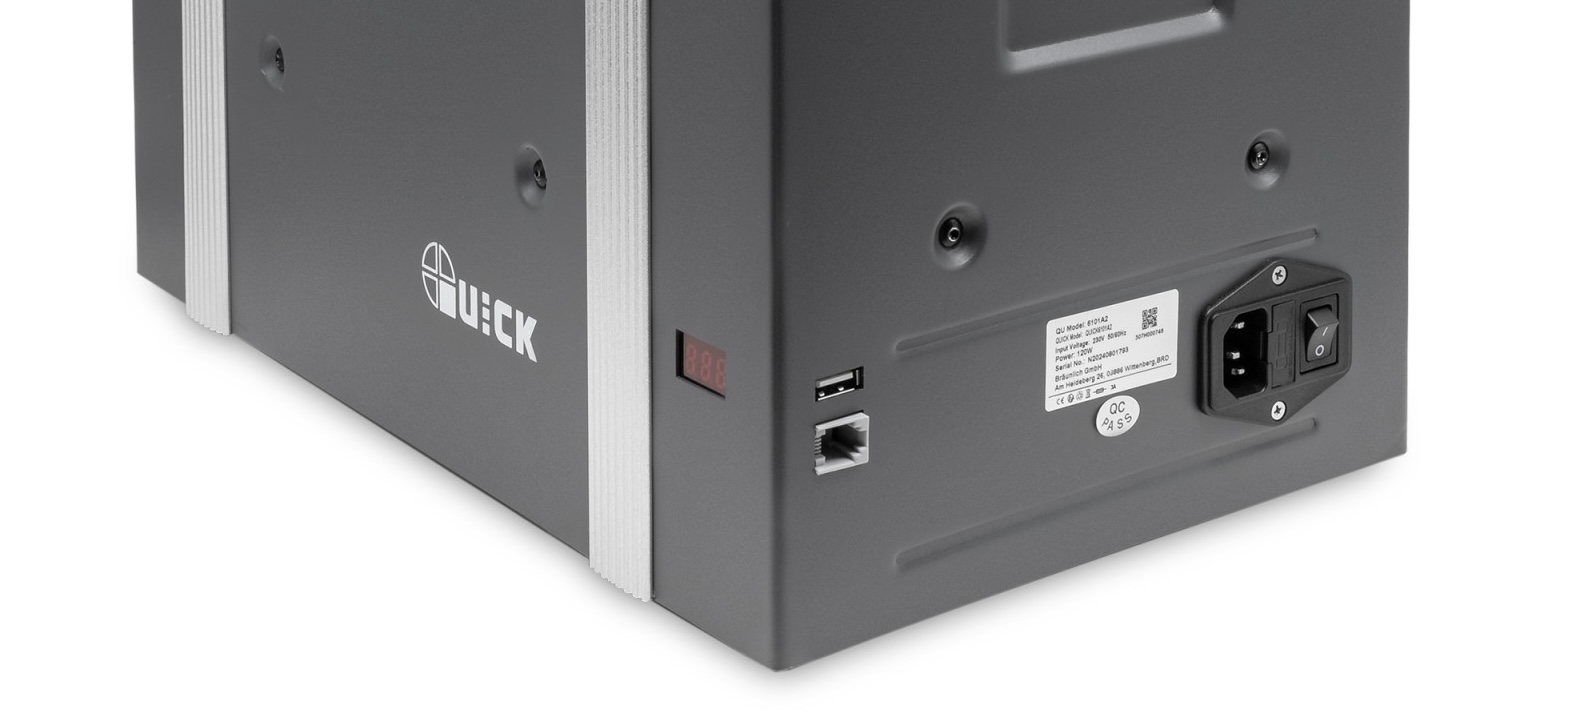 The connectors for the
controller and an external tool.
The connectors for the
controller and an external tool.
It's Always Serial
The first suspicious observation is that the controller is connected to the unit
with a USB-A cable. Using USB for something this simple sounds unlikely, and I
did not want to attach Cynthion
straight away in case it wasn't actually USB and I'd end up blowing the USB
analyzer. So I probed the data pins with an oscilloscope instead. As expected,
the signals look like RS-232, not USB, and they decode nicely into serial data
at 19200 baud.
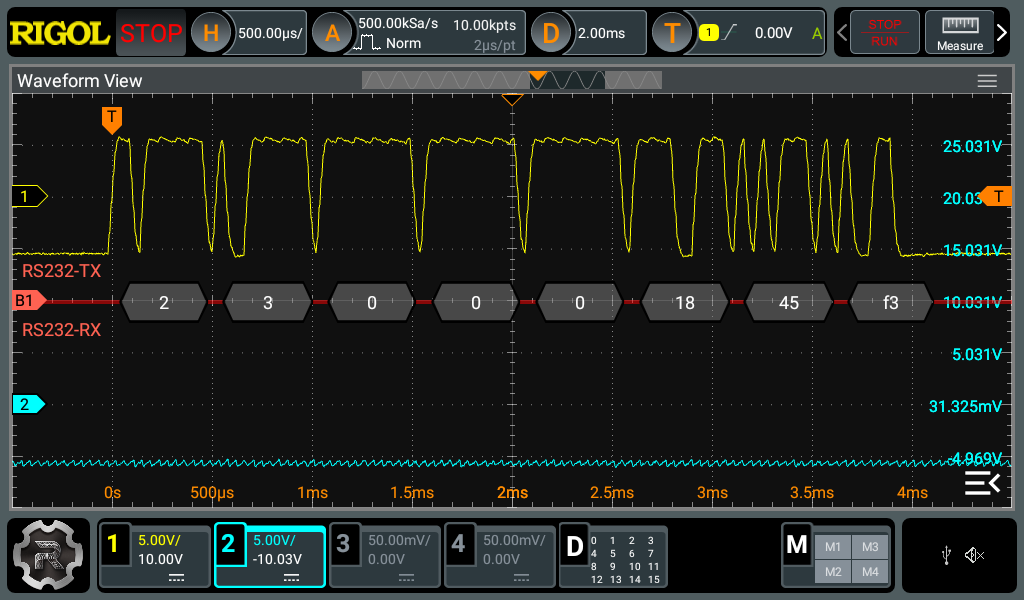 The
decoded frame from the controller unit (19200; 8N1).
The
decoded frame from the controller unit (19200; 8N1).
The connector has this pinout:
| USB-A Pin | Signal | Notes |
|---|
| 1 | 5V | The base unit provides power |
| 2 | RS-232 | Controller's TX (D- in real USB) |
| 3 | RS-232 | Controller's RX (D+ in real USB) |
| 4 | GND | |
Before diving into figuring out what those bytes mean, I wanted a longer
capture. An oscilloscope isn't ideal for that. The simplest option would be a
USB-RS232 adapter, but we'd need two to capture TX and RX and then sync them,
which feels cumbersome. A logic analyzer is a better fit. Because this is real
RS-232 (±6 V in this case), the signal has to be level-shifted to TTL to avoid
blowing my logic analyzer. I had a
MAX233
(multichannel RS-232 driver/receiver) in my parts bin, which makes the
conversion easy since it doesn't need external capacitors or extra circuitry.
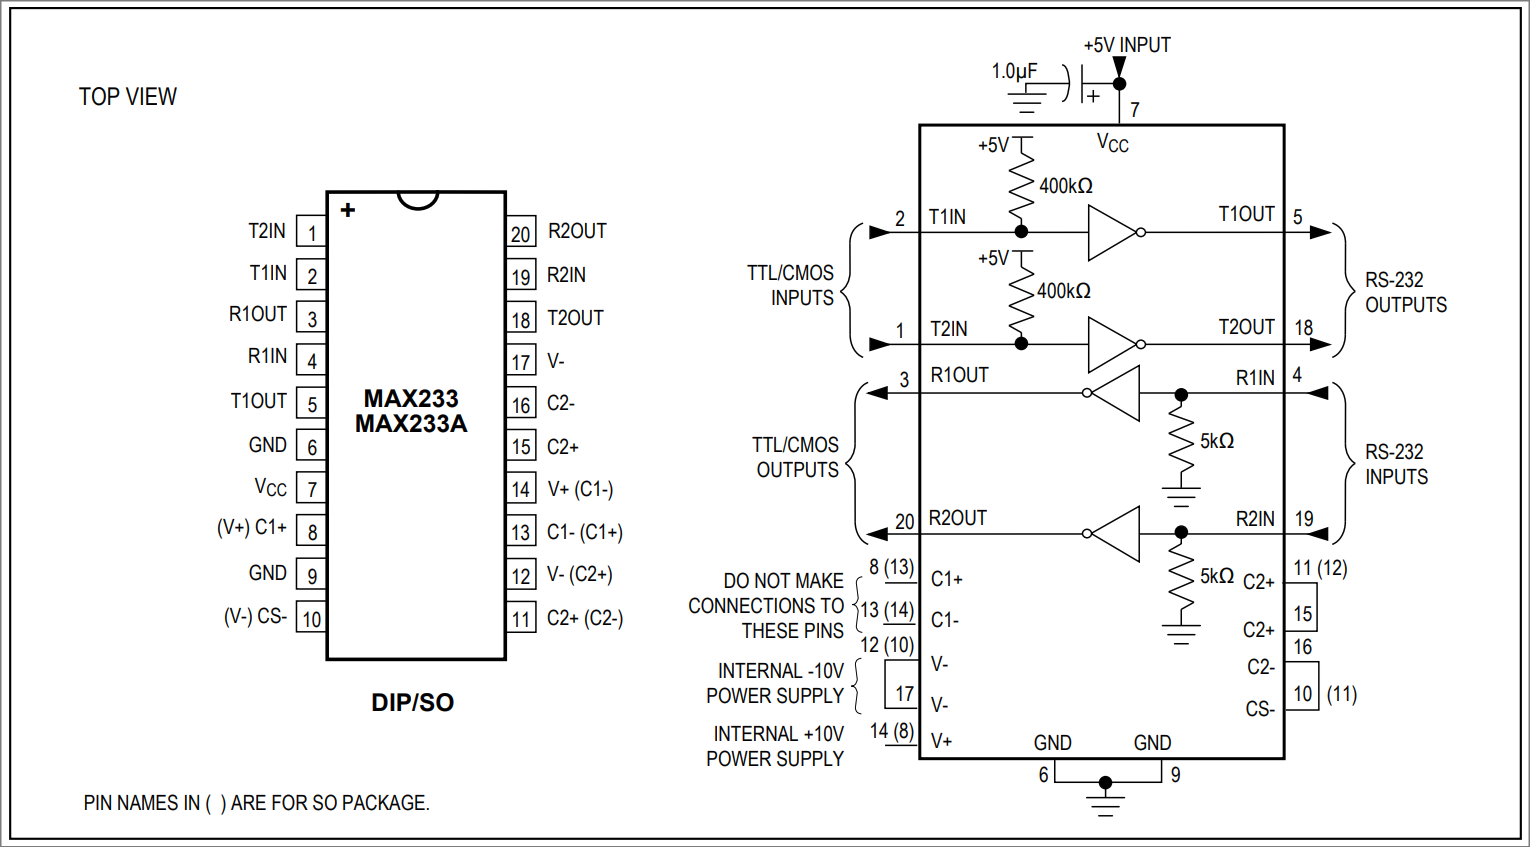 MAX233 Pin Configuration and Typical
Operating Circuit.
MAX233 Pin Configuration and Typical
Operating Circuit.
The typical operating circuit is more than enough to tap into an existing
RS-232 line as shown above. Here we connect Quick's TX and RX lines into RS-232
inputs (pins 4 and 19), and the logic analyzer to TTL outputs (pins 3 and 20).
That setup lets us capture a nice long stretch of communication between the
controller and the unit.
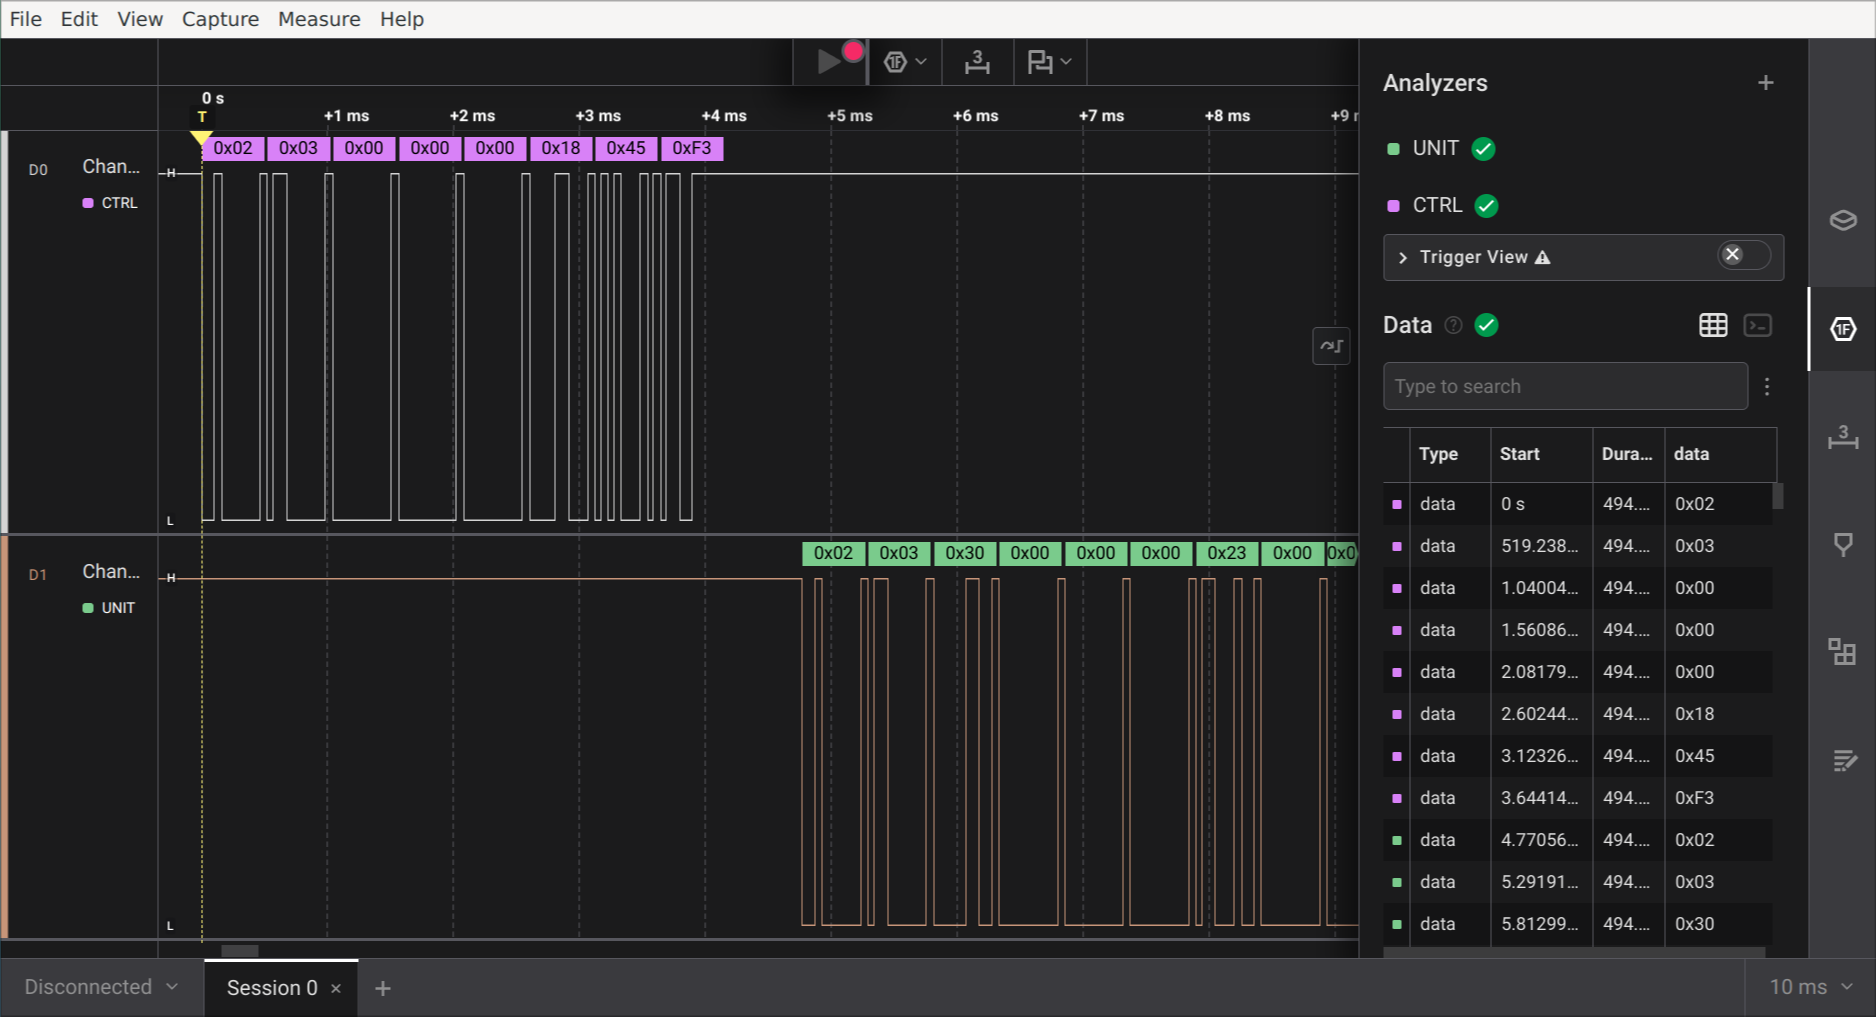 Captured traffic between the controller and
base unit in Logic 2.
Captured traffic between the controller and
base unit in Logic 2.
Making Sense of the Bytes
Now we have a long list of meaningless bytes. Let's try to find some patterns in
it. The first observation is that the controller always starts the communication
by sending a frame to the unit, and the unit responds by sending one frame
back. When idle (not touching the controller), it keeps sending the same 8-byte
ping/status request, and the unit responds with 53 bytes. Most likely this is
the controller querying the unit status, since live data such as airflow and
motor speed is shown on the controller's screen.
If we take a close look at the request bytes:
0x02 0x03 0x00 0x00 0x00 0x18 0x45 0xF3
A good guess is that the last two bytes are some kind of checksum. Usually
engineers don't want to reinvent the wheel, so it makes sense to try a CRC
before diving too deeply into this.
crccalc.com
is a great tool to quickly calculate the common CRC variants at once, and indeed
we have a match. CRC-16/MODBUS outputs 0xF345, which is encoded as
little-endian in the request.
As mentioned, you don't want to reinvent the wheel. Since the checksum uses the
MODBUS variant of CRC-16, it's a reasonable guess that the application layer
would be Modbus RTU as well.
Modbus RTU
is a simple and common industrial protocol used to let devices talk to each
other over serial links such as RS-232 or RS-485.
The Modbus specification defines the general frame structure as a Protocol Data
Unit (PDU), independent of the underlying transport. The PDU contains the
Function Code (what action the server should perform) and the data (parameters
for that action). The PDU is carried inside an Application Data Unit (ADU),
which adds fields such as the server address and CRC.
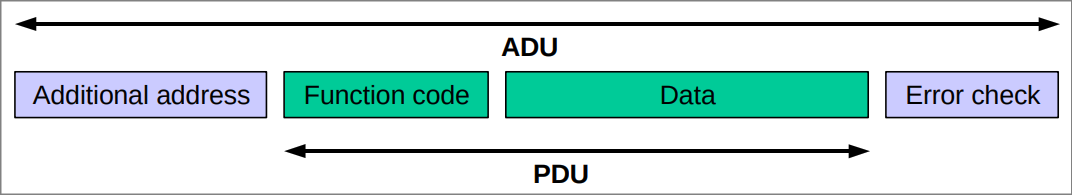 General
 MODBUS frame.
For RS-232/RS-485, the ADU is defined as
<Server address (1 byte)> <PDU (max 253 bytes)> <CRC (2 bytes)>
In addition, the specification describes these function codes
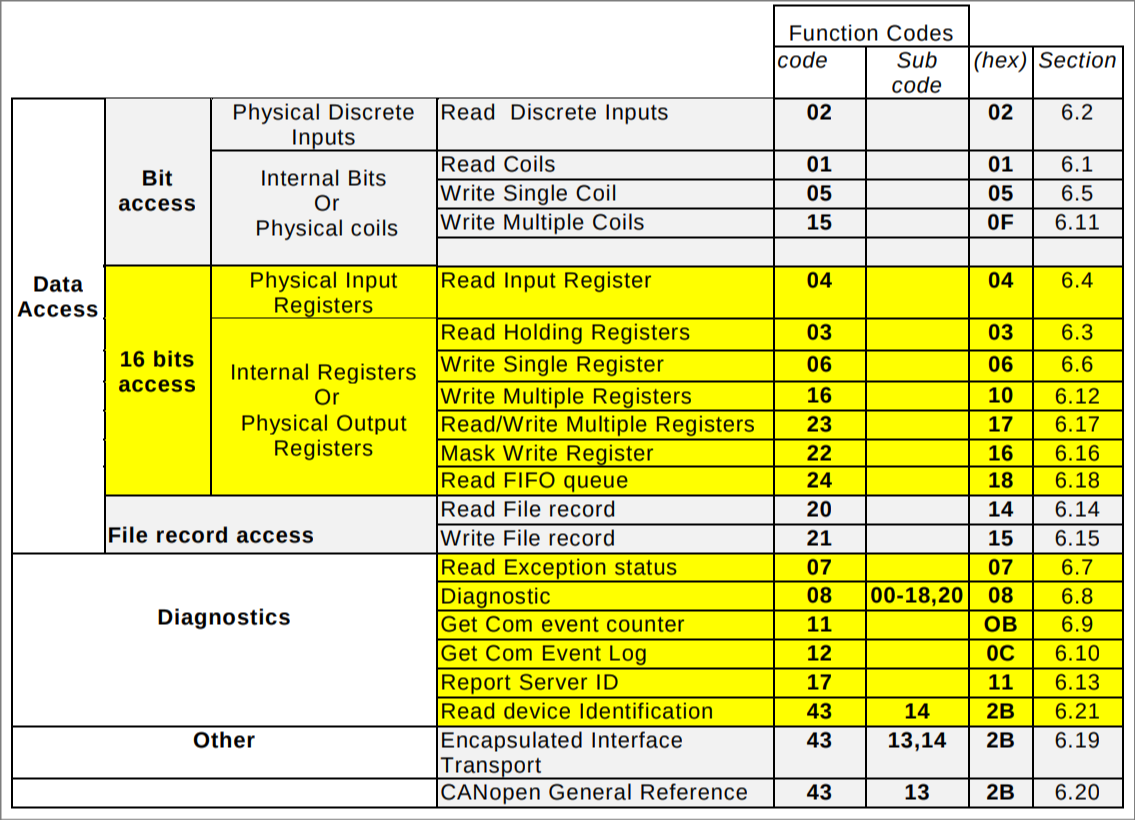
MODBUS Function Code
Definitions.
Our request frame matches the above definition:
0x02 0x03 0x00 0x00 0x00 0x18 0x45 0xF3
<--> <--> <-----------------> <------->
 |    |    |                   |----- CRC (ADU)
 |    |    |------------------------- Data
 |    |------------------------------ Function Code
 |----------------------------------- Address (ADU)
The Address field in the ADU seems to always be 0x02. Based on the above
function code table, 0x03 maps to Read Holding Registers, which is used to
read the contents of multiple registers. That matches our hypothesis. The
arguments for Read Holding Registers are defined as follows:
Starting Address:      2 bytes
Quantity of Registers: 2 bytes
The register-read response frame has this structure, with each register packed
into two bytes.
Function Code:   1 byte
Data length:     1 byte
Register values: <Data length> bytes
Using those definitions, the data in the read request decodes into:
Starting Address:      0x0000
Quantity of Registers: 0x0018
and therefore the response size should be:
PDU = 1 + 1 + 2*0x18 = 50 bytes
ADU = 1 + PDU + 2    = 53 bytes
That matches as well. At this point, we can be pretty sure we're dealing with
Modbus RTU. We can treat the link as Modbus RTU and start interpreting the
register data rather than raw bytes. One parsed Read Holding Registers
response decodes into these values, which don't look random to me:
reg: 0x0000 = 0x0001 (1)
reg: 0x0001 = 0x0023 (35)
reg: 0x0002 = 0x0000 (0)
reg: 0x0003 = 0x0000 (0)
reg: 0x0004 = 0x0000 (0)
reg: 0x0005 = 0x0000 (0)
reg: 0x0006 = 0x00C8 (200)
reg: 0x0007 = 0x04B0 (1200)
reg: 0x0008 = 0x0960 (2400)
reg: 0x0009 = 0x0000 (0)
reg: 0x000A = 0x0001 (1)
reg: 0x000B = 0x0000 (0)
reg: 0x000C = 0x9600 (38400)
reg: 0x000D = 0x0000 (0)
reg: 0x000E = 0x0DFC (3580)
reg: 0x000F = 0x004B (75)
reg: 0x0010 = 0x028A (650)
reg: 0x0011 = 0x02EE (750)
reg: 0x0012 = 0x0000 (0)
reg: 0x0013 = 0x192A (6442)
reg: 0x0014 = 0x0023 (35)
reg: 0x0015 = 0x0000 (0)
reg: 0x0016 = 0x0000 (0)
reg: 0x0017 = 0x0000 (0)
Making Sense of the Registers
There is definitely less chaos now, but we're still missing the meaning of these
individual registers. Figuring them out should be straightforward: some values
already map directly to what the controller shows, such as target airflow, and
in addition, we can use the device and see which registers change (turning it
on/off, changing settings, etc.). With that approach, I came up with this
mapping. The unknown registers stayed constant across all captures and state
changes in this analysis.
| Address | Name | Units | Notes |
|---|
0x0000 | State | - | 0 = OFF, 1 = ON |
0x0001 | Target flow | m3/h | Target airflow |
0x0002 | - | - | Observed 0 |
0x0003 | - | - | Observed 0 |
0x0004 | - | - | Observed 0 |
0x0005 | - | - | Observed 0 |
0x0006 | P-Filter limit | km3 | Maximum airflow rate |
0x0007 | M-Filter limit | km3 | Maximum airflow rate |
0x0008 | C-Filter limit | km3 | Maximum airflow rate |
0x0009 | - | - | Observed 0 |
0x000A | Communication address | - | Modbus device address |
0x000B | - | - | Observed 0 |
0x000C | Baud rate | - | Communication baud rate |
0x000D | Beeper | - | Beeper state |
0x000E | Speed | rpm | Fan speed |
0x000F | Tube diameter | mm | Tube diameter |
0x0010 | - | - | Observed 650 |
0x0011 | - | - | Observed 750 |
0x0012 | - | - | Observed 0 |
0x0013 | - | - | Observed 6442 |
0x0014 | Real flow | m3/h | Measured airflow |
0x0015 | - | - | Observed 0 |
0x0016 | - | - | Observed 0 |
0x0017 | - | - | Observed 0 |
The table still has many unknown registers, most of which are zero. Three of the
zero-valued registers likely belong to the filters' airflow counters. However,
my counters still show zeros, so it's not possible to map them yet. In addition,
the user manual defines three different error states. I have no idea whether
there are individual registers for those errors, or just a single one.
Changing the State
There isn't much to setting the registers. The controller uses the Write Single
Register (0x06) function to write a 16-bit value into a specific register.
The request has these arguments:
Register Address: 2 bytes
Register Value:   2 bytes
The response is an echo of the request. For example, setting the target airflow
to 36 m3/h (0x0024) looks like.
0x02 0x06 0x00 0x01 0x00 0x24 0xD8 0x22
<--> <--> <-------> <-------> <------->
 |    |    |         |         |----- CRC (ADU)
 |    |    |         |--------------- Register Value
 |    |    |------------------------- Register Address
 |    |------------------------------ Function Code
 |----------------------------------- Address (ADU)
Similarly, toggling the power uses register 0x0000 with 0x0001 for ON and
0x0000 for OFF.
PoC || GTFO
Let's put the above pieces together and create a PoC terminal monitor to
interact with the fume extractor. The
modbus-rtu crate actually takes the
heavy lifting by implementing the Modbus RTU protocol for us. So, our job is
pretty much just to parse the correct registers and show them in the UI. The
monitor shows power state, target flow, real flow, fan speed, and register
values in real time. You can find the source on
GitHub.
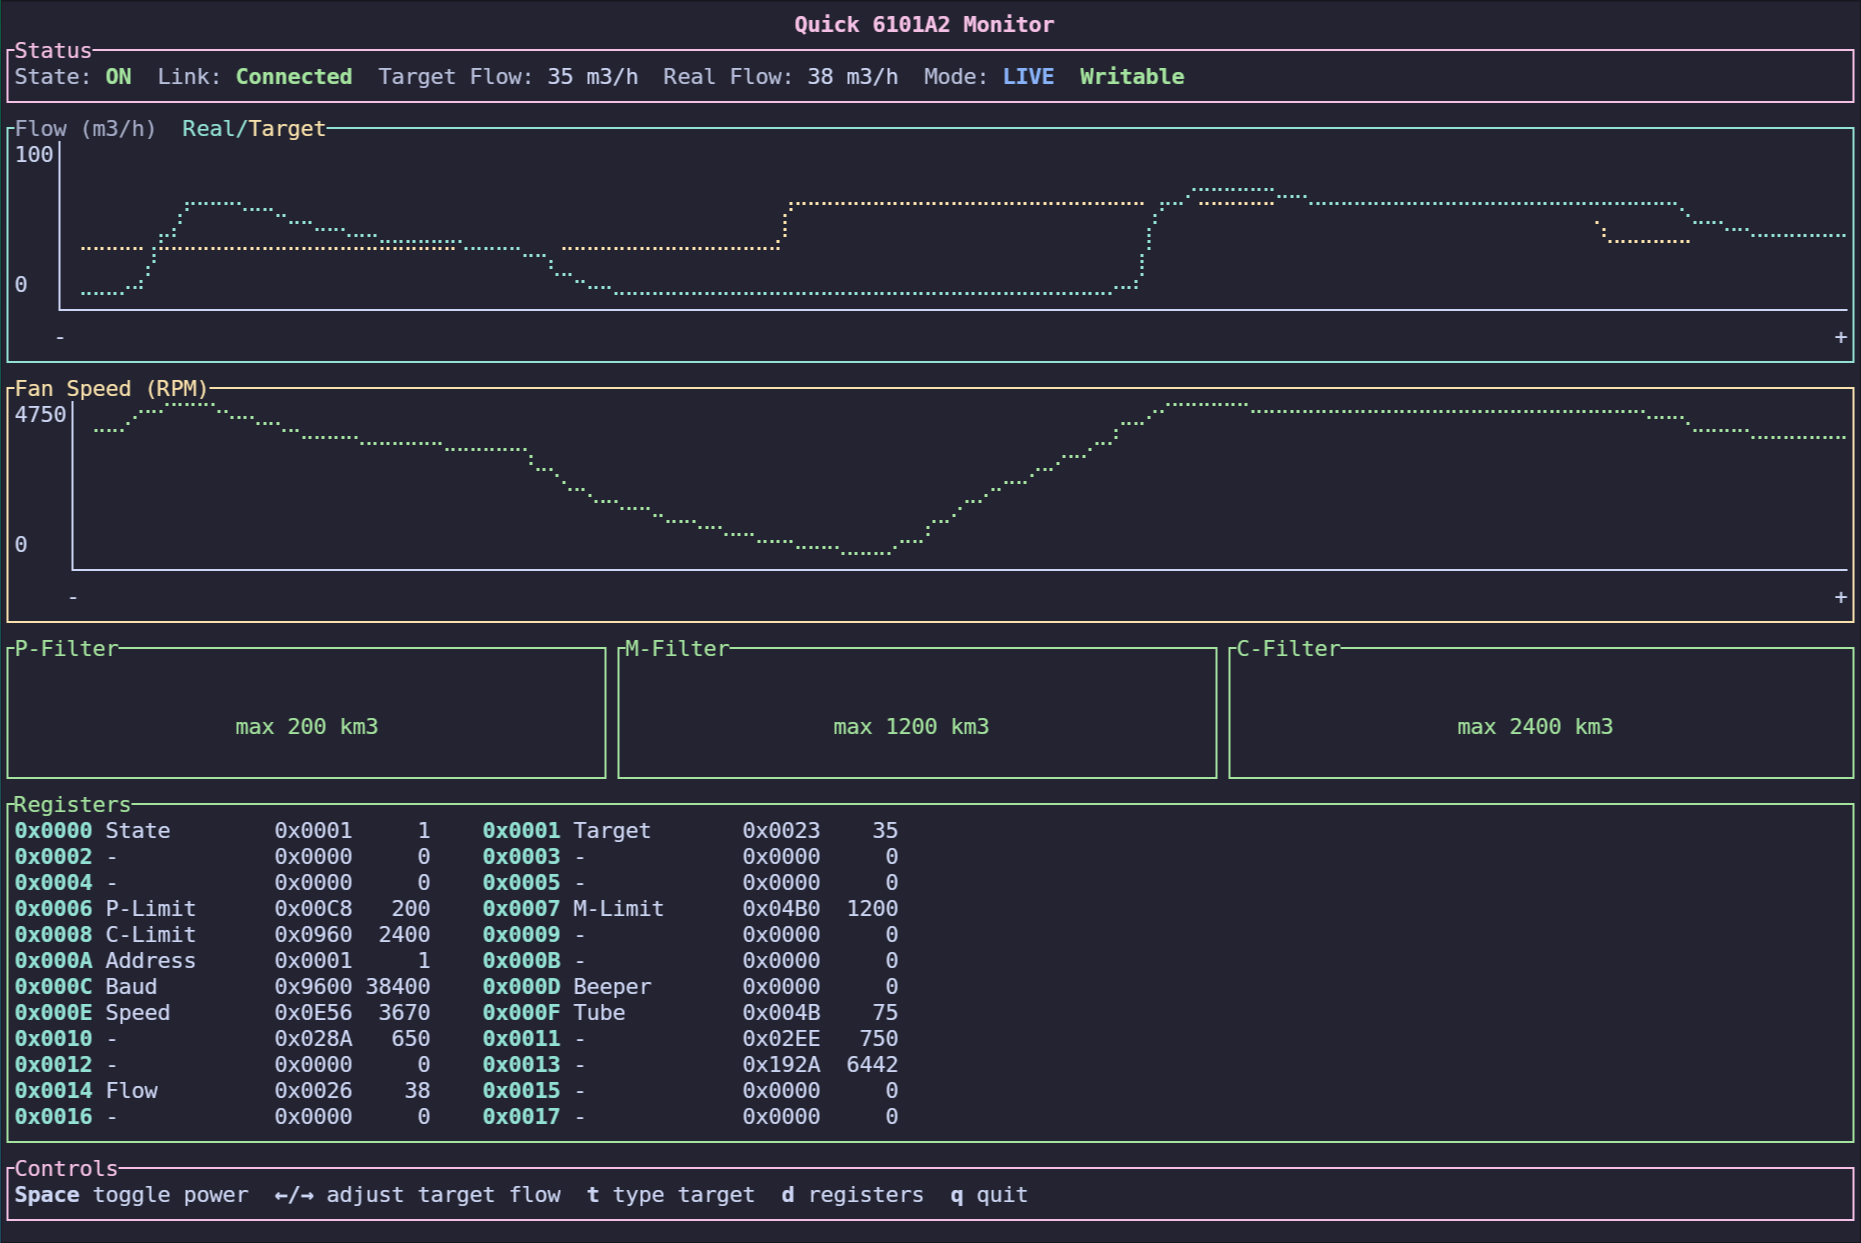 Terminal Monitor for Quick 6101A2.
Future Work
This is the end of part 1 of reverse engineering the Quick 6101A2. Figuring out
the controller protocol gives us a solid foothold to understand the device
internals. Next I want to take a closer look at the external tool connection and
try to dump the main unit firmware to figuring out the purpose of the unknown
registers. In addition, I also still need to build the proxy device so my
soldering and hot-air stations can turn the fume extractor on automatically.